
I'm building Liquet in public. Once a month it reconciles a firm's cash records against its bank statement. Rules match what they can, an AI agent investigates what's left, and a person approves. The data is synthetic, for a made-up wealth manager.
My first article ended on one idea: the question comes first. My question was reconciliation. But reconciliation isn't one question. It's a group of questions that live in the head of the person doing it, and every firm asks them a little differently. This article shows how I turned those questions into a graph, and why it looks the way it does. It's a design, not a result: none of this graph is built yet.
The short version. Most questions in a reconciliation are walks through the records: from a bank line to our entry, to the portfolio, to the client. So I built the graph from those walks, with each step stored once as a named link. Every decision is stored too, as a finding linked to the records it's about. That's what will let an AI agent explain a difference instead of only flagging it.
1. The outcome is not the question
A reconciliation isn't a check that two closing balances agree. They can agree by accident, when two mistakes cancel each other out, and a payment on the wrong side of month-end is a break even when the totals look fine. The work is checking every amount on both sides, joining one end to the other and making sense of every line on the way.
But when you design a system for it, the easiest thing to model is the outcome: the two closing balances and whether they agree. That fits in a table, and a sum produces it. The work that gets you there doesn't, and that work is what I wanted Liquet to capture.
The work is a sequence of questions the person closing the month asks. Which of our entries is this bank line? Why does this one differ? Whose money is it? Can I sign this off? A model can only show a process in as much detail as the questions you ask about it, so knowing what to ask is the core of the work.
Most of the answers are a walk through the records: from the bank line to our entry, to the portfolio, to the client who owns it. That walk is the logic of the reconciliation. Usually it lives in someone's head, or gets rebuilt with lookups in every month's spreadsheet. And every firm walks it a little differently, with matching rules nobody ever wrote down. That's why the logic has to come from the firm's own process, not from a template. So I followed the person closing June and wrote every question down.
2. What kind of graph answers a process
Graphs are built for different kinds of questions, so before drawing anything I had to decide which kind mine was. I had four in front of me.
A temporal graph shows the whole network as it was at any moment, so it answers questions about time, like a live balance or the state of everything on a given day. A knowledge graph is built around meaning: what things are and how ideas relate, usually with a formal vocabulary. A process graph is built around the steps of the work. And process mining uses an event graph, which joins process and time: every event is its own record, linked to the things it's about, and the order of events is stored as links too.
The person closing the month never asks for the whole network on a given day, so I left the temporal graph out. My graph does capture knowledge, the reconciler's, but it doesn't define what things mean. It records how one record leads to the next. So it's a process graph.
The steps, though, happen to dated things: a client's payment in mid-June, a trade at the end of June that the bank only pays in July. So I borrowed the event graph's main idea. Every payment, statement line and trade is a record of its own, with its own date, linked to the client, portfolio, security or account it's about. That's also why a payment can't just be a link: a match links a bank line to an entry, and a link needs a record at each end.
I kept the dates on the events instead of linking each event to the next one, because the person asks what a line is and whose it is, not what happened straight after it. The only order stored as a link is between months: when an open item clears, a link joins it to the line that cleared it.
Then the shape. A reconciliation has two sides, what the bank says and what the firm says, and matching only ever happens across them. A bank line is matched to the firm's entries, never to another bank line. Graph people call two groups that only link across each other bipartite.
And a decision isn't always about two records. One bank transfer can pay five fee entries, and the decision about them has details of its own: an explanation, a status, an approver. A link can't hold all that, so each decision became a record: a finding, linked to every record it's about. A link that joins many records is what graph people call a hyperedge, and a finding plays that part. That gives the graph two layers: the records the bank and the firm sent, and the findings on top, which hold what Liquet and the person decided.
3. What's in the graph
Here is the result: the graph for version 1.
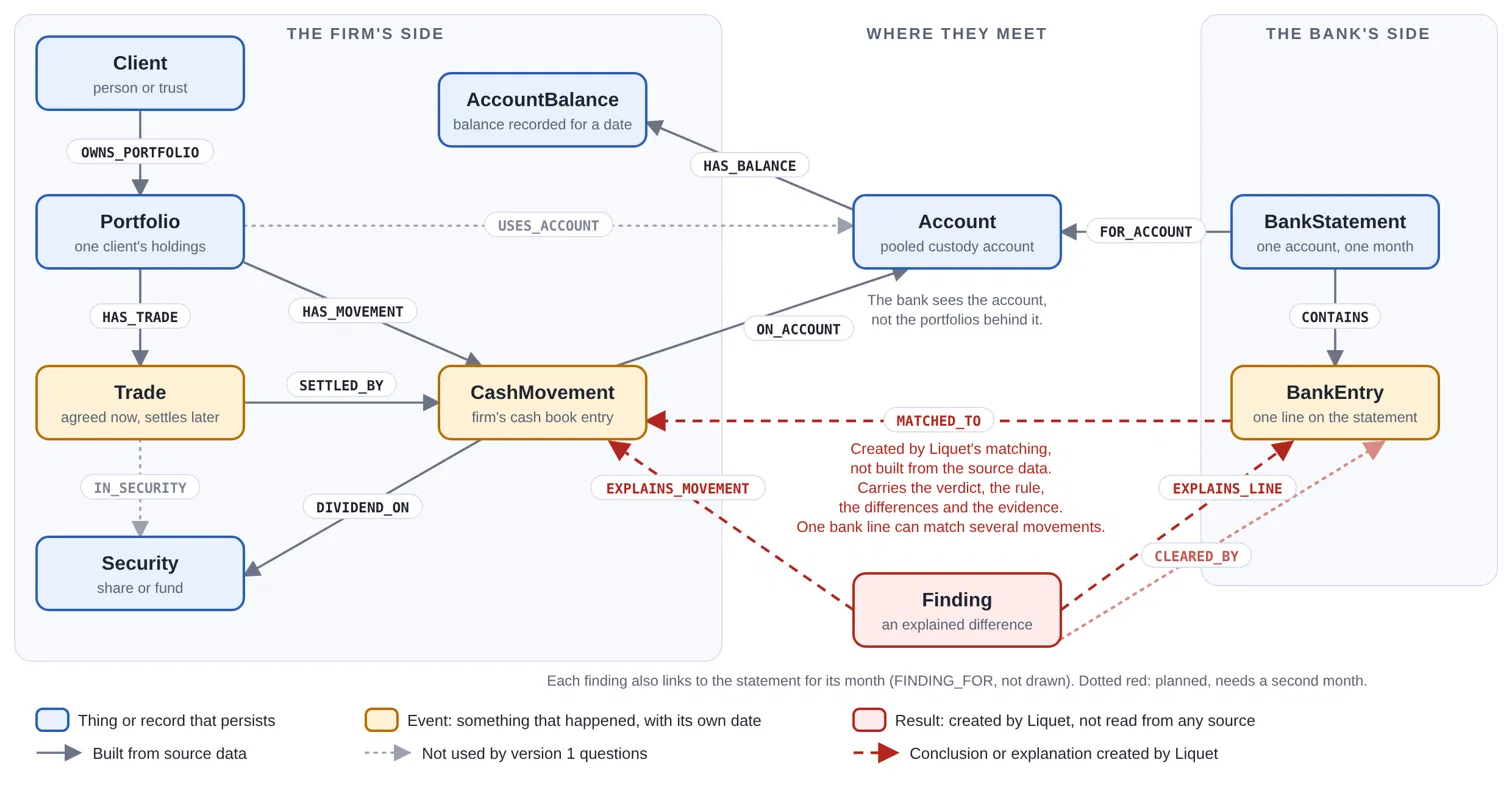
The bank's side holds what the bank sends: the monthly statement and every line on it. The firm's side holds what the firm records: its clients, their portfolios, the securities they hold, their trades, and every cash entry it books. The two sides meet at the account: the bank's statement is for it, and the firm's entries are booked to it.
| Record | Side | What it holds |
|---|---|---|
Bank statement (BankStatement) | Bank | One month's statement for the account |
Bank line (BankEntry) | Bank | Each line on the statement: date, amount and the bank's description |
Account (Account) | Where both meet | The bank account both sides describe |
Client (Client) | Firm | The people and trusts the firm manages money for |
Portfolio (Portfolio) | Firm | Each client's portfolio |
Security (Security) | Firm | The shares and funds in the portfolios |
Trade (Trade) | Firm | Each purchase or sale, with its own date |
Cash entry (CashMovement) | Firm | Each payment the firm booked: date, amount and what it was for |
Month-end balance (AccountBalance) | Firm | The balance the firm recorded at the end of each month |
Finding (Finding) | Created by Liquet | A decision about a match or a difference: explanation, status and approver |
The colours in the picture follow the same idea. Blue records last: clients, portfolios, securities, the account. Amber records are events with their own date: cash entries, statement lines and trades. Red records are findings. No source file creates them; Liquet and the person do.
The links read like the work: a client owns a portfolio, a portfolio has cash entries and trades, a trade is settled by a cash entry, a dividend is paid on a security, a statement contains its lines. Two links are grey, because no version 1 question uses them yet. They're true and cheap, so I kept them, but they're marked rather than pretended.
4. Following one bank line
Every month starts the same way: take a line from the bank statement and look for the firm's entry that matches it.
When it matches by the firm's own rules, Liquet records the match
(MATCHED_TO) and moves on. Most lines end here, and a rule is enough.
When more than one entry fits, the walk decides. A line says
FASTER PAYMENT NAIR P, £5,000, and the firm booked two £5,000 entries two
days apart: Priya Nair's and the Hart Family Trust's. Follow each entry to its portfolio
and its client, and only one is called Nair. Liquet proposes that match, with the
reason the other entry was ruled out, and a person confirms it. A name is evidence, not
proof.
When it doesn't, the question changes from "which entry is this?" to "why is it
different?", and the walk gets longer. Sometimes there's no entry at all, like interest
the bank paid that the firm never booked. A dividend arrives smaller than the firm
recorded: follow the entry to its security, and it's an overseas share, taxed before it
was paid. The fees the firm booked don't add up to what the bank took: check each one
against the fee schedule, follow the one that's off to its portfolio and client, and you
know whose money it is. Each answer is stored as a finding, linked to the bank line it
explains (EXPLAINS_LINE) and to the firm's entries it explains
(EXPLAINS_MOVEMENT). A person reads it and approves it, or doesn't: the
agent prepares, a person reviews, the same split auditors expect to see.
When it isn't clear, Liquet says so. A difference isn't always a yes or a no; often it's blurry. Sometimes even the walk doesn't settle it: the evidence points both ways, or nothing explains the difference yet. Then the finding gets the verdict non liquet: it isn't clear, so a person decides.
Some open items explain themselves later. A share bought at the end of June is paid for
in July, so its finding stays open, and next month Liquet looks for it first. The trade
already says when the cash should arrive, so the item isn't just open: it's expected on
a date. When the payment turns up, a link joins the old finding to the line that cleared
it (CLEARED_BY), which supports the explanation June could only propose. If
that date passes, it becomes a real break and gets older until a person acts.
So the graph doesn't just hold the records. It holds the reconciliation as it was done: what matched, what differed, why, who signed it off, and what's still open.
Three parts of this design came from walking a month by hand before writing any graph code. The month-end balance is there because the very first question needed it. Each finding carries an approver because signing off needs a name. And the link between months exists because open items need somewhere to go.
5. Asking why
This is where the design should pay off. Picture the person closing the month asking: why doesn't this line match? In a spreadsheet, the answer is a status and maybe a comment, cut off from the records that prove it. Here, the agent will be able to walk the same links the person would: from the line to the entries, to the portfolio, to the client, and to any finding already written about them.
So it can answer with the path and the evidence, not just a verdict. It does that by calling a small set of tested tools rather than writing its own queries, so every step it takes can be checked.
Because findings stay in the graph, the agent also knows what was decided before: last month's open item, an explanation a person already approved, a difference that has since cleared. The reconciliation is recorded as a process, so it can be read back as one.
6. From findings to rules
A reconciliation gets faster when its patterns are shared, and findings are where the patterns show. If the same question gets the same answer every month, like dividends from one overseas share always arriving with tax already taken off, the agent can propose it as a rule. A person approves it and tests it like any other rule, and from then on it's matched without the agent. That's how a firm's unwritten matching rules get written down, one at a time.
But only if it's how things normally work. If the firm forgets to book the custody fee every month, that's the same mistake repeating, and a rule would only hide it. The fix is to start booking the fee.
Each good question leaves something behind in the system: a link, a record or a rule. So the better the questions get, the better the system gets at answering them. The job is what stops that from turning into a graph of everything.
7. What I haven't tested
None of this graph is built yet, and nothing here shows that it helps the agent. That's the real test still to come: the same month, one agent with graph tools and one with plain tables, scored on whether it finds the right explanation and says non liquet when it should. The data is small and synthetic, too: five portfolios, one account, one month and six planted differences.
Version 1 also runs once a month. If that cash is client money, monthly is the minimum UK rules allow for this check, and a firm whose client money moves every day should usually reconcile every business day. Daily would be a bigger test.
I expect parts of this design to change once I build the matching rules, and the next article will say which.
If your questions are different, your graph may be too.
The project is at github.com/sonjba/Liquet. The first article is Does the Graph Earn Its Cost?
A note on how I wrote this: the design decisions and the data are mine. I used AI tools (Claude) to help me edit the text, as English is not my first language.